
Software Engineering
Final Project
Login to the system is done by entering email and password and pressing on the Login button as seen in the picture.
If the user is not registered to the system, he can click the Sign up button and navigate to the Sign Up page.


To register to the system the user should enter the following details:
-
First Name
-
Last Name
-
Institute
-
Degree
-
Email
-
Password
If the user already registered he can navigate to Sign In page
After signing in, the user will be navigated to the home page.
3 options will be displayed:
-
Upload new data
-
Process your data
-
Visualize your data
The user should select upload new data to upload datasets to website.

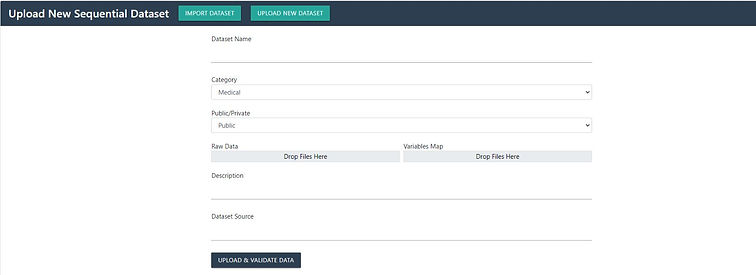
when uploading new dataset, the user have to fill all the fields down as in the picture.
where the buttons you have to upload new files are:
raw data
variable map
entities
when the user done to fill all the fields and upload all the files he should click on "Upload & Validate Data" button.
If the user wants to upload sequential dataset he should click on "Upload Sequential Dataset" button.

In this page only raw data and variable map are required files.
The raw data file is ascii file containing sequential events information.
The variable map is the same as regular datasets.
After clicking at the home page on the "Process Your Data" button the user will be navigated to the processing data page.
If the user uploaded a regular dataset he should select "Temporal Abstraction" button to convert the dataset to sequential format. The user should select at the abstraction method the sequential option and click on "Run"
If the user uploaded a sequential dataset this step is not required.

Afterwards the user should select pattern mining and at this page select the sequential button.
Here the user need to fill paremters for the sequential pattern algorithm:
-
mvs (minimum vertical support) – minimum percentage of records in the database that needs to contain a pattern for the pattern to be considered as frequent.
-
max gap – maximum gap of time units between following events in the sequence.
-
minimum negatives – how much negative events can happen on the same time.
-
ofo (One for One) – Can negative event must be on a specific time unit or can be between two positive events.
-
as (Allow Same) – Can a pattern consist of a negative event followed by the same event with the positive sign.
-
bc (Boundary Constraint) – Can a pattern start or finish with a negative event.
Then the user should click on "Mine" button to run the sequential pattern algorithn or the "Mine & Visualize" button to run the algorithm and add this dataset to visualztion menu.

To see visualiztion of the sequential dataset the user should select ""Visualize Your Data" button at the home page and select dataset from the list. Then the user should select "Negative Tirps" button.

The picture below describes the pattern investigation table. Each row represent an event that happend at the start of pattern. Clicking on a row will open to the user a timeline and more information about the current pattern investigated.
Clicking on the "Next" button will change the table and display all the events that occured in this time or afterwards in the pattern.

The picture below describes the time line opened after expending the current pattern.
Bars that displayed in the same time are describing an events that occured at the same time.
¬ sign describes a negative events.

The picture below describes the data info table after clicking on a row.
Current Level - The amount of events in the current pattern.
Vertical Support – The percentage of records in the database that contains.
the current investigated pattern.
Mean Horizontal Support – Avg occurrences for an entity to have that
pattern.
Mean Mean Duration – The avg duration of this pattern.

After clicking the "Get Relations" button a relations matrix that describes the relations between the different events at the current patern will be opened.

The picture below describes the tirps table and nav bar after expending the current pattern.

To compare patterns of the sequential dataset the user should select ""Visualize Your Data" button at the home page and select dataset from the list. Then the user should select "NTirps Search" button.

The picture below describes NTirps serach page. At this page the user should select: first symbol, intermediate symbol and last symbol which represent an events that occured in a pattern at the start, in the middle and at the end.
Also the user can select minimun and maximum values of Vs/Mhs/Tirp size. After clicking on search a 2-d axis graph that compares several matching sequential patterns will be displayed.Each pattern will be bubble on the graph. The comparison is based on the values of the Vs/Mhs/Mmd.

The picture below describes a populated bubble graph after clicking the search button.
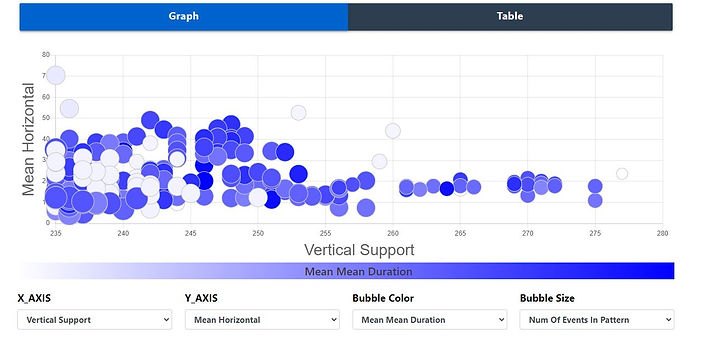
The user can click on the table button and the bubbles would be displayed as rows in a table, similiar to the NTirps table page.

The user can click on the bubbles/rows on the graph. This will open a timeline similiar to the NTirps table page and also will open current pattern info table as the picture below describes. This table shows similiar data to the tirp info table of the NTirps table page and also "Explore Tirp" button which clicking it will take the user to the NTirps table page with the selected pattern displayed.
